Chronic disease patterns are often hidden across PDFs, dashboards, raw datasets, and research articles. This hub brings those pieces together so public health patterns can be explored through clearer charts, evidence summaries, and data stories.
Diabetes is the first complete topic area, and the larger structure is built to grow into heart and hypertension, cancer, kidney disease, vision loss, amputation, and other public health topics.
Key Focus Areas
🩸 Chronic Disease Prevalence & Incidence
🏥 Hospital Utilization Patterns
🧪 Clinical Indicators & Complications
🗺️ NYC Borough and U.S. State Comparisons
📚 Research Evidence & Public Health Storytelling
📍 Neighborhood-Level and Population-Level Disparities
JV HSA Medical Data Hub
Diabetes Data Hub
Explore diabetes dashboards, hospital discharge patterns, A1C control, NYC Epi 2025 inequities, research articles, Hispanic/Latino evidence, and prescription drug data in one organized section.
First Complete Topic AreaDiabetes
Built from SPARCS, NYC DOHMH, CDC, A1C Registry, research PDFs, and curated resource links.
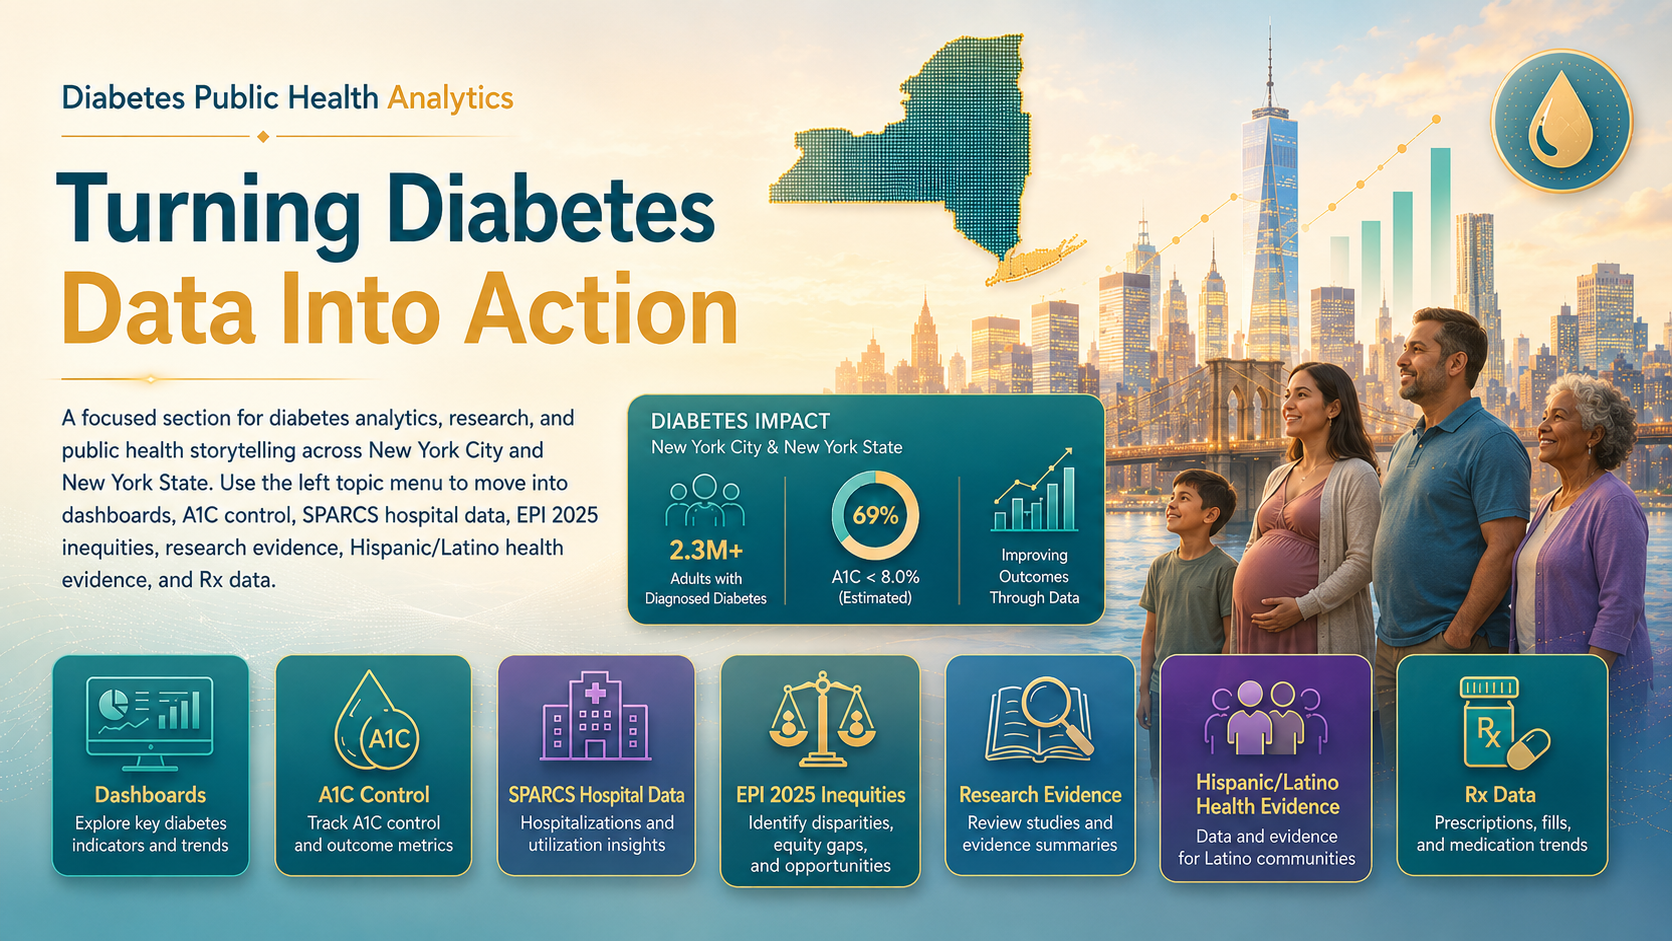
Diabetes Public Health Analytics
Turning Diabetes Data Into Action
A focused section for diabetes analytics, research, and public health storytelling across New York City and New York State. Use the left topic menu to move into dashboards, A1C control, SPARCS hospital data, EPI 2025 inequities, research evidence, Hispanic/Latino health evidence, and Rx data.
Hispanic and Latino diabetes evidence organized around disparities, social determinants, culture, care access, and technology.
Research LibraryHispanic/Latino diabetes articles, PDFs, and source websites.
DisparitiesRace/ethnicity, Medicare, social determinants, obesity, hypertension, and mortality.
Care ContextLanguage, culture, text messaging interventions, CGM access, and community support.
💊
Diabetes Topic View
Rx Data
Prescription drug analytics for diabetes-related medications, payer views, high-volume drugs, and resource links.
Medication ViewDrug names, prescription counts, payer filters, and ranking controls.
Payer LensAll payers and payer-specific comparisons.
Resource LinksTools and references for medication data exploration.
👁️
Planned Diabetes Topic
Vision Loss
Future page for diabetic retinopathy, blindness, eye disease, screening, and CDC/VEHSS evidence.
🦵
Planned Diabetes Topic
Amputation
Future page for lower-extremity amputation, SPARCS data, EPI 2025 rates, prevention, and borough inequities.
🏥
Planned Diabetes Topic
Hospital Programs
Future directory for NYC hospital diabetes education, nutrition counseling, A1C control, CGM support, foot care, and prevention programs.
📊
Diabetes Analytics Dashboard
SPARCS 2024 Summary
New York State Inpatient Data
SPARCS 2024 Diabetes Inpatient Dashboard
Explore 2024 SPARCS inpatient discharge records for diabetes-related hospital use across New York City boroughs. The dashboard compares discharges, average length of stay, total inpatient costs, emergency department cases, race/ethnicity patterns, and borough-level map views.
Five-borough NYC reference map. Click a borough shape to filter the dashboard to that borough.
📊 Diabetes Inpatient Discharges — All NYC Boroughs (26,147)
📈 2024 Diabetes Discharges by Age Group
🏥 Avg Length of Stay by Borough (days)
🚨 Emergency Department Share % by Borough
🧬 2024 Diabetes Discharges by Race/Ethnicity (Patient Count)
💵 2024 Total Inpatient Charges vs Costs by Borough (Diabetes, NYC)
📋 Borough Comparison Table
Borough
SPARCS Discharges
Avg Length of Stay
Total Costs
ED Cases
ED Share
🏙️ Bronx
5,466
5.9 days
$179.6M
4,416
80.8%
🏘️ Brooklyn
6,303
6.7 days
$209.2M
5,205
82.6%
🌆 Manhattan
7,891
5.6 days
$274.2M
4,378
55.5%
🌏 Queens
4,991
5.6 days
$112.3M
3,611
72.4%
🌳 Staten Island
1,496
5.5 days
$34.4M
1,060
70.9%
🧪
A1C Blood Sugar Control
A1C Control, Complications, and National HbA1c Trends
NYC A1C Registry 2022 JAMA / Healio 2025
A1C Blood Sugar Control Across New York City
This page brings together NYC A1C Registry data, SPARCS amputation data, national HbA1c control research, CDC diabetes estimates, and Bronx food-insecurity evidence to compare poor blood sugar control, diabetes complications, and related disparities across boroughs.
11.3%Diabetes prevalence — All NYC Boroughs794K adults in 2022
13.9%A1C > 9% very high blood sugar86,768 adults with last A1C > 9%
3,184Diabetes-related amputations43.7 per 100,000 adults
A1C > 9% is treated as very high blood sugar in NYC DOHMH Epi Data Brief No. 146.
📊 A1C Range Distribution
Ranges show the latest A1C value among NYC adults with diabetes receiving medical care in 2022.
📈 A1C > 9% Trend — All NYC Boroughs
Trend uses the older dashboard baseline style for interactivity; 2022 is anchored to the NYC A1C Registry.
🦵 Amputations vs Dialysis — All NYC Boroughs (2022)
Amputations come from SPARCS 2022 in the Epi Data Brief. Dialysis cases are included as a companion diabetes-burden indicator from the citywide reduction plan/dashboard draft.
👥 A1C by Age / National Control
JAMA 2025 found control among adults ages 20-44 fell from 57.4% to 37.1% after 2020.
📌 CDC Key Estimates + 95% CI
CDC National Diabetes Statistics Report: age-adjusted diagnosed, undiagnosed, and total diabetes prevalence among U.S. adults, 2021-2023.
🗽 NY Prevalence vs Selected States
New York diagnosed diabetes prevalence is below the U.S. median in the CDC state table, but the trend is still increasing.
📈 Incidence Rate per 1,000
CDC incidence rates show newly diagnosed diabetes burden by race/ethnicity and place, measured per 1,000 adults.
🍽️ Bronx Food Insecurity + Poor A1C Evidence
Bronx article evidence: Hispanic patients and food-insecure patients carried higher poor-A1C burden in the study population.
📋 A1C Borough Comparison Table
Borough
Diabetes Prevalence
A1C > 9%
A1C Results
Amputations
Amputation Rate
Dialysis Cases
NYC A1C Registry
In 2022, 86,768 NYC adults with diabetes had a latest A1C greater than 9%, equal to 13.9% of adults in the registry with an A1C result.
Bronx Food Article
The Bronx food-insecurity study connects individual food need and neighborhood food access to poor A1C control among adults with type 2 diabetes.
JAMA / Healio 2025
National glycemic control worsened after 2020. Young adults ages 20-44 had the sharpest decline in HbA1c < 7% control.
CGM Article
The CGM pilot focused on Hispanic adults with insulin-treated type 2 diabetes, baseline HbA1c around 9.78, and no recent CGM use.
📈
EPI 2025: NYC Diabetes Inequities
Diabetes Prevalence, A1C Control, and Amputations
NYC DOHMH Epi Data Brief No. 146
Diabetes Prevalence Among New York City Adults
This page summarizes NYC DOHMH's 2025 Epi Data Brief on diabetes and health inequities. In 2022, more than 794,000 New York City adults had diabetes, representing 11.3% of adults citywide.
The strongest pattern is inequality: the Bronx had the highest borough prevalence, Latino and Black New Yorkers had nearly double the prevalence of white New Yorkers, and very high poverty neighborhoods had the highest amputation burden.
NYC Adults with Diabetes794K+11.3% of adults in 2022
Highest Borough Prevalence15.1%Bronx adults
Highest Amputation Rate74.5Bronx, per 100,000 adults
🏙️ Diabetes Prevalence by Borough — 2022
Topic Highlight
15.1%
Bronx had the highest borough prevalence.
🧪 A1C Blood Sugar Control by Borough
Table 1 · Prevalence of Diabetes Among New York City Adults Ages 18 and Older by Demographic Characteristics, 2022
Source: Community Health Survey, 2022. CHS 2022 includes adults sampled from an address-based sampling / Web frame. Data are weighted to the adult residential population per the American Community Survey, 2021. Data are age-adjusted to the US 2000 Standard Population except those stratified by age group. Cases of gestational diabetes were considered not to have diabetes.
Age
Sex
Race/Ethnicity
Borough of Residence
Neighborhood Poverty
NYC Overall · % and 95% CI
Age Group · % and 95% CI
Sex · % and 95% CI
Race/Ethnicity · % and 95% CI
Neighborhood Poverty · % and 95% CI
Borough · % and 95% CI
Table 2 · Diabetes Prevalence by UHF 34 Neighborhood
Community Health Survey 2022 estimates show adult diabetes prevalence by UHF 34 neighborhood. New York City overall: 794,000 adults, 11.3% (95% CI 10.4-12.3). Estimates are weighted to the adult residential population and age-adjusted to the US 2000 Standard Population.
Bronx
Brooklyn
Manhattan
Queens
Staten Island
Table 3 · Blood Sugar Control Among Adults with Diabetes Receiving Medical Care
NYC A1C Registry 2022 data show the latest A1C distribution among adults with likely diabetes who received medical care. New York City overall: 622,518 adults with an A1C result; 86,768 had last A1C greater than 9%.
NYC Overall
Age Group
Sex
Neighborhood Poverty
Borough
Table 4 · Adults with Diabetes Receiving Medical Care with Last A1C > 9%
NYC A1C Registry 2022 data show the number and percent of adults with diabetes whose last A1C was greater than 9%, by UHF 42 neighborhood. New York City overall: 86,768 of 622,518 adults, or 13.9%.
Bronx
Brooklyn
Manhattan
Queens
Staten Island
Table 5 · Diabetes-Related Lower Extremity Amputations by Demographics
SPARCS 2022 shows 3,184 diabetes-related lower-extremity amputations among NYC adults. Rates are age-adjusted per 100,000 adults.
NYC Overall
Age Group
Sex
Race/Ethnicity
Neighborhood Poverty
Borough
Table 6 · Diabetes-Related Amputations by UHF 42 Neighborhood
SPARCS inpatient files 2022 show diabetes-related lower extremity amputation rates by UHF 42 neighborhood. New York City overall: 3,184 diabetes-related LEAs, 43.7 per 100,000 adults. Rates are age-adjusted to the US 2000 Standard Population.
Bronx
Brooklyn
Manhattan
Queens
Staten Island
Definitions and Implications
Diabetes: Includes adults who self-reported diagnosed diabetes, were recorded in hospitalization claims with diabetes diagnosis codes, or had a history of two or more A1C tests greater than 6.5%, regardless of diabetes type.
A1C: A1C reflects average blood sugar over roughly three months. In this brief, A1C greater than 8% is not meeting blood sugar goals, and A1C greater than 9% is considered very high.
Diabetes-related lower extremity amputation: Hospitalizations with both a diabetes-related diagnosis and a non-traumatic lower limb amputation procedure code.
Policy implication: The brief connects diabetes inequities to structural and social drivers of health, including poverty, racism, housing instability, nutrition access, and the built environment.
📋 EPI 2025 Summary Table
Measure
Highest Group
Value
Public Health Meaning
Diabetes prevalence by borough
Bronx
15.1%
The Bronx carries the highest borough-level adult diabetes burden.
Diabetes prevalence by race/ethnicity
Latino adults
14.0%
Latino and Black adults have nearly double the prevalence of white adults.
Diabetes prevalence by age
Adults 65+
26.3%
Older adults carry the highest prevalence and need strong chronic-care support.
Diabetes prevalence by neighborhood poverty
Very high poverty neighborhoods
14.6%
Diabetes burden rises where economic hardship is greatest.
Lower-extremity amputation rate
Bronx
74.5 per 100,000 adults
Complications show the cost of unequal prevention and diabetes control.
Source: NYC Department of Health and Mental Hygiene, Epi Data Brief No. 146, May 2025. Data shown from Community Health Survey 2022, NYC A1C Registry 2022, and SPARCS 2022 as reported in the brief.
📰
Research Articles
Peer-Reviewed Studies
Diabetes / Public Health
Article Finder
Search Research Articles
Showing all articles
No matching research articles found.
💉
2022 : Renal disease in patients with type 2 diabetes: Magnitude of the problem, risk factors and preventive strategies
Summary
Chronic kidney disease affects an estimated 27% of Type 2 diabetes patients globally — with the highest prevalence in the USA. Key risk factors include uncontrolled A1C, hypertension, proteinuria, obesity, and duration of diabetes. Early-onset Type 2 diabetes carries a 3.58x higher ESRD risk than late-onset. GLP-1 receptor agonists and SGLT-2 inhibitors show significant kidney-protective effects with long-term use.
2025 : Diabetes and Health Inequities among New York City Adults
Summary
Official NYC DOHMH report (May 2025) documenting diabetes prevalence, blood sugar control, and lower-extremity amputations across all five boroughs. In 2022, 800,000+ NYC adults had diabetes (11.3%). Black (14%), Latino (14%), and Asian/PI (13%) New Yorkers were nearly twice as likely to have diabetes as white (7%) New Yorkers. The Bronx had the highest amputation rate at 74.5 per 100,000. Very high poverty neighborhoods had 3x the amputation rate of low-poverty neighborhoods.
SPARCS Long/Short Term Complications and Amputations
Summary
Shows SPARCS PQI diabetes indicators for NYC from 2009 to 2023, with focus on short-term complications, long-term complications, and lower-extremity amputations.
2025 : Epidemiological Patterns of Diabetes Mellitus in The United States of America: An Observational Multicenter Analysis From 1990 to 2024
Summary
Multicenter observational analysis of diabetes incidence and prevalence patterns across the United States from 1990 to 2024, stratified by age, sex, race, and diabetes type.
2025 : Navigating Continuous Glucose Monitoring Adoption: Insights From Hispanic Adults With Insulin-Treated Type 2 Diabetes
Summary
Explores barriers and facilitators to continuous glucose monitoring adoption among Hispanic adults with insulin-treated Type 2 diabetes, including cost, insurance coverage, provider guidance, and lived experience after CGM trial use.
Renal Disease in Type 2 Diabetes: Magnitude, Risk Factors, and Prevention
Diabetes & Metabolism, 2022
This chart page explains how kidney disease becomes a major complication of type 2 diabetes and why early prevention matters.
JournalDiabetes & Metabolism, 2022
Study DesignPeer-reviewed clinical review
ParticipantsPeople with type 2 diabetes and diabetic kidney disease risk
LocationsGlobal evidence with strong United States relevance
Summary
This review explains that chronic kidney disease is a common and serious complication of type 2 diabetes. It links kidney damage to high blood sugar, high blood pressure, obesity, protein in the urine, and longer diabetes duration. The article also highlights prevention tools, including early screening and kidney-protective medications.
Key Findings
Diabetic kidney disease affects a large share of people with type 2 diabetes.
Early prevention and kidney-protective treatments can help slow progression toward kidney failure.
10.5%
Global diabetes prevalence, 2021
536.6M adults ages 20–79
12.2%
Projected prevalence, 2045
783.2M adults projected
30–40%
T2DM patients who may develop DKD
About one-third overall
2–3×
Higher cardiovascular risk with DKD
GFR loss + albuminuria add risk
📊 Diabetes and DKD Burden
What this means: DKD is not rare. Around one-third of people with diabetes may develop diabetic kidney disease, and type 2 diabetes is the largest driver of ESRD worldwide.
🌎 Global Diabetes Growth, 2021 to 2045
What this means: The diabetes population is projected to grow sharply by 2045, which means more people may need kidney-protection care.
💵 Diabetes Health Expenditure Forecast
What this means: Diabetes care already costs hundreds of billions globally, and kidney complications can add more pressure to health systems.
🛡️ Prevention and Kidney-Protection Signals
What this means: Prevention is the main story. Glycemic control, RAAS blockade, SGLT2 inhibitors, GLP-1 agonists, and finerenone are tools that can help slow DKD progression.
🧬 DKD Clinical Progression Pathway
What this means: DKD can move from hyperfiltration to albuminuria, hypertension, proteinuria, GFR loss, and ESRD. The article stresses that early prevention is better than waiting for late-stage kidney failure.
Diabetes and Health Inequities Among New York City Adults
NYC DOHMH Epi Data Brief No. 146, 2025
This chart page summarizes diabetes prevalence, blood sugar control, and lower-extremity amputations across New York City.
JournalNYC Department of Health and Mental Hygiene data brief
Study DesignPublic health surveillance report using city health data
ParticipantsNew York City adults with diabetes indicators in 2022 datasets
LocationsBronx, Brooklyn, Manhattan, Queens, and Staten Island
Summary
This report shows that diabetes is not evenly distributed across New York City. It documents higher diabetes prevalence among Black, Latino, and Asian/Pacific Islander adults compared with white adults, and it shows major differences in amputation rates by borough, sex, race, and neighborhood poverty.
Key Findings
More than 794,000 NYC adults had diabetes in 2022.
The Bronx had the highest diabetes prevalence and the highest amputation rate among boroughs.
Very high poverty neighborhoods had much higher amputation rates than low-poverty neighborhoods.
Key Findings — Tables 1, 3 & 5
794K
NYC Adults with Diabetes
↑ 11.3% of all NYC adults · 2022
15.1%
Bronx Diabetes Prevalence
↑ Highest borough · vs 7.9% Manhattan
16.5%
Bronx A1C >9% (Poor Control)
↑ Highest borough · vs 10.4% Staten Island
3,184
NYC Diabetes Amputations 2022
↑ 43.7 per 100,000 people
74.5
Bronx Amputation Rate
↑ per 100,000 · 2× Manhattan rate
3×
Very High vs Low Poverty Amputation
↑ 81.8 vs 27.1 per 100,000
🔍 Key Finding: Latino and Black New Yorkers have nearly double the diabetes prevalence of white New Yorkers (14.0% and 13.6% vs 7.0%). Males have 3.4× the amputation rate of females (70.5 vs 21 per 100,000). The Bronx has 74.5 amputations per 100,000 — the highest of any borough — driven by the intersection of high diabetes prevalence, poor A1C control, and extreme neighborhood poverty.
Patients With Diabetes Struggling to Afford Food and Control Their HbA1c in Food-Insecure Areas in Bronx, NY
Public Health Nutrition, 2024
This chart page explains how food need and neighborhood food access connect to poor blood sugar control.
JournalPublic Health Nutrition, 2024
Study DesignObservational study using clinical and neighborhood food-access data
Participants5,500 Bronx adults with type 2 diabetes
LocationsBronx, New York
Summary
This study found that Bronx diabetes patients who reported food insecurity had higher odds of poor blood sugar control. The pattern remained important even when people lived in food-secure neighborhoods, showing that individual food need can still be hidden inside broader neighborhood measures.
Key Findings
Patients reporting food need had higher odds of poor A1C control.
Food insecurity mattered even in neighborhoods labeled as food secure.
Insurance status, age, and race/ethnicity also shaped poor-control risk.
📄 Research Article & Data — Food Insecurity
Full data breakdown from Chambers et al. 2024 — Albert Einstein College of Medicine · Bronx, NY
Key Findings — Tables 1, 2 & 3
21.5%
Patients with Poor A1C (≥9%)
↑ 1,183 of 5,500 patients
1.59×
Adjusted Odds — Food Need vs None
↑ aOR 1.59 (CI: 1.26–2.00)*
1.83×
Food Need in Food-Secure Area
↑ Highest risk group (aOR 1.83)
1.48×
Uninsured vs Commercially Insured
↑ aOR 1.48 (CI: 1.12–1.95)*
43.1%
Hispanic Patients in Study
↑ Largest racial/ethnic group
0.41×
Age 65+ Protective Effect
↓ Lower odds of poor control
🔍 Counterintuitive Finding: Patients with food insecurity living in food-SECURE neighborhoods had the HIGHEST odds of poor glycemic control (aOR 1.83) — even higher than those in food-insecure areas (aOR 1.72). Individual food need, not neighborhood food access, is the primary driver.
🗺️ Bronx Food Insecurity Bivariate Map
Food need + area insecurity (highest risk) Food need + area secure No food need + area insecurity Low on both dimensions
Adapted for portfolio storytelling from Chambers et al. 2024, Fig. 1. Zone shapes are approximate Bronx reference areas built with Leaflet/OpenStreetMap; the popup text connects each area to the article’s bivariate food-need categories.
📊 Chart 1 · Poor A1C by Race/Ethnicity (Table 1)
📊 Chart 2 · Poor A1C by Insurance Type (Table 1)
📊 Chart 3 · Adjusted Odds Ratios — Food Need Groups (Table 3)
New York State Diabetes-Related Amputation: A Horror Story
Health People Special Report, 2022
This chart page turns the report’s warning into a prevention-focused amputation data story.
JournalHealth People special report
Study DesignPublic health report using state and city amputation trend data
ParticipantsNew Yorkers affected by diabetes-related lower-extremity amputations
LocationsNew York State and New York City boroughs
Summary
This report argues that diabetes-related amputations rose sharply in New York while prevention systems failed to respond strongly enough. It connects amputation trends to missed prevention, delayed foot care, and the severe health and cost consequences of limb loss.
Key Findings
New York State diabetes-related amputations increased sharply from 2009 to 2017.
New York City saw an even larger increase than the state overall.
Major amputations carry high cost and high five-year death risk, but early foot care can prevent many cases.
Projected Total49,367 NY amputations, 2009-2021
State Increase84.1% from 2009-2017
NYC Increase92.4% from 2009-2017
Major Amputation57% five-year death rate
📈 Diabetes-Related Amputation Rate Trends — NYC Boroughs + NY State
What this means: The Bronx started high and kept rising, but every borough shows a worsening pattern by 2017. This supports the report's warning that prevention failed across the city.
🏙️ 2009–2017 Increase Comparison
What this means: New York's increase was far above the national increase, and NYC rose even faster than the state overall.
🧮 Documented vs Projected Amputations
What this means: The report estimates that the four missing data years may account for more amputations than the documented 2009–2017 period.
⚠️ Five-Year Death Rate After Amputation
What this means: Amputation is not just a foot problem. The report frames it as a major survival risk, especially after major limb loss.
🦶 Prevention Impact Examples
What this means: The report argues that amputations can be reduced when health systems invest in early foot care, education, and regular wellness visits.
What This Means
These charts turn the article's warning into a clear data story: diabetes-related amputations rose sharply in New York, the Bronx and NYC were hit hard, the missing years may hide even more harm, and prevention can work when health systems act early.
SPARCS PQI Data: Diabetes Indicators in NYC
NY State SPARCS De-Identified Adult PQI Data
This chart page uses real hospital inpatient Prevention Quality Indicators to show diabetes complications and lower-extremity amputation patterns.
JournalNY State public hospital discharge dataset
Study DesignAdministrative data dashboard using PQI rates
ParticipantsAdult hospital discharges represented in SPARCS PQI records
LocationsBronx, Brooklyn, Manhattan, Queens, and Staten Island
Summary
This data page compares diabetes long-term complications, short-term complications, and lower-extremity amputation rates across NYC boroughs. It helps show where preventable hospital outcomes remain high and where borough-level gaps are strongest.
Key Findings
The Bronx has a much higher 2023 amputation rate than Manhattan.
Long-term diabetes complications remain a major inpatient burden.
Borough trends show why local prevention and outpatient care access matter.
52.0
Bronx Amputation Rate 2023
↑ per 100,000 people
25.3
Manhattan Amputation Rate 2023
↑ per 100,000 people
2.1×
Bronx vs Manhattan Gap
↑ Bronx rate more than double
248.1
Bronx Long-Term Complications 2023
↑ per 100,000 people
🦵 Amputation Rate by Borough — 2023
🏙️ All PQI Indicators by Borough — 2023
📅 Bronx Amputation Trend 2009–2023
📈 Amputation Trend All Boroughs 2009–2023
Source: NY State SPARCS De-Identified Adult PQI by County — dataset iqp6-vdi4 · Rates per 100,000 people · 2009–2023
Diabetes Incidence and Prevalence: CDC National and State Trends
CDC National and State Diabetes Trends Report, 2024 archive
This chart page turns the CDC trend report into a dashboard-style summary of diagnosed diabetes, new diagnoses, age patterns, and state variation.
JournalCDC public health trend report
Study DesignNational and state surveillance summary
ParticipantsUnited States adults represented in diabetes surveillance data
LocationsUnited States and state-level comparisons
Summary
This report shows how diagnosed diabetes prevalence and incidence have changed over time in the United States. It separates total diabetes burden from new-case momentum and shows why age and state-level context matter for prevention planning.
Key Findings
Diagnosed diabetes prevalence has increased across the long-term trend.
New diagnosed cases rose sharply in earlier years and then eased.
Older adults and some states carry a higher diabetes burden than national averages suggest.
Long-Term Rise
Diagnosed diabetes prevalence
Trend has climbed across decades
Incidence Shift
New diagnosed cases
Rose, peaked, then eased
Age Gradient
Older adults carry higher burden
Risk increases with age
State Gaps
Burden differs across states
Prevention needs local context
📈 Diagnosed Diabetes Prevalence Trend
What this means: The report’s big story is long-term growth. Even when year-to-year changes slow, the national diagnosed-diabetes burden remains much higher than earlier decades.
🧭 New Diagnosed Cases Pattern
What this means: New diagnoses rose sharply before easing. That pattern helps separate total burden from new-case momentum.
👥 Diabetes Burden by Age Group
What this means: Diabetes is not evenly distributed by age. Screening, prevention, and chronic-care planning need to account for the much higher burden in older adult groups.
🗺️ State Burden Tiers
What this means: State-level differences matter. A national average can hide places that need stronger prevention, insurance access, food access, and primary care investment.
Source: CDC archive report, Diabetes Incidence and Prevalence. Charts are simplified dashboard visuals for portfolio storytelling.
Epidemiological Patterns of Diabetes Mellitus in the United States, 1990 to 2024
Observational multicenter analysis, 2025
This chart page summarizes long-term diabetes patterns by time, type, age, and demographic disparity signals.
JournalPeer-reviewed epidemiology article, 2025
Study DesignObservational multicenter analysis
ParticipantsUnited States population groups stratified by diabetes type and demographics
LocationsUnited States
Summary
This article reviews diabetes patterns in the United States from 1990 to 2024. It shows that diabetes burden increased over time, type 2 diabetes drives most population-level burden, and averages can hide differences by age, race, sex, and diabetes type.
Key Findings
Diabetes burden increased across the long-term study window.
Type 2 diabetes accounts for most population-level diabetes burden.
Age and demographic differences are important because averages can hide disparities.
1990-2024
Study window
Long-term epidemiology view
Type 2
Dominant diabetes pattern
Largest share of burden
Older Age
Higher-risk group
Age gradient remains central
Disparities
Not evenly distributed
Race, sex, and type matter
📈 Diabetes Burden Index, 1990 to 2024
What this means: The article frames diabetes as a long-running growth problem. Indexing the trend makes the direction easy to see without pretending one number tells the whole story.
🧬 Type 1 vs Type 2 Pattern
What this means: Type 2 diabetes drives most of the population-level burden, while type 1 diabetes remains important for care access, insulin needs, and lifelong management.
👥 Age Pattern Across Adulthood
What this means: Age stratification matters because diabetes burden rises across adulthood. Prevention should start earlier, but chronic-care support must scale for older adults.
⚖️ Demographic Disparity Signals
What this means: The article’s stratified approach is important because averages can hide differences by race, sex, age, and diabetes type.
Source: Epidemiological Patterns of Diabetes Mellitus in the United States of America, 1990 to 2024. Charts are simplified dashboard visuals for portfolio storytelling.
Hispanic Diabetes: Data, Culture, and Care
Research-backed charts and evidence about diabetes patterns, care access, social determinants, and prevention across Hispanic and Latino communities.
Hispanics
Hispanic and Latino communities carry a diverse diabetes burden shaped by culture, family history, neighborhood conditions, food access, income, insurance coverage, language access, and trust in care. This section looks across Hispanic populations while still keeping room for subgroup differences that can be hidden when all communities are treated as one single category.
Hispanic DiabetesCulture & CareNYC Public HealthResearch Articles
Key Finding: Hispanic diabetes data should be interpreted with culture, access, and community context in mind. Broad labels can hide meaningful differences, so prevention work should include screening, food access support, culturally aware education, primary care access, and heart-health prevention.
Source Articles
Article Finder
Search Hispanic Articles
Showing all articles
No matching Hispanic articles found.
🌎
2019 : Understanding Diabetes in Hispanic Adults Living in the United States
Summary
English: Explains how social, cultural, economic, biological, and health care access factors contribute to type 2 diabetes burden among Hispanic adults.
Spanish: Explica como la vida diaria, la cultura, el dinero, el cuerpo y el acceso al doctor pueden afectar la diabetes tipo 2 en adultos hispanos.
2020 : The Prevalence of Type 1 Diabetes in Hispanic/Latino Populations in the United States
Summary
English: Uses HCHS/SOL data to estimate type 1 diabetes prevalence across Hispanic and Latino subgroups, separating the smaller type 1 diabetes story from the larger type 2 diabetes burden.
Spanish: Usa datos de un estudio grande para mostrar cuantas personas hispanas y latinas tienen diabetes tipo 1. Tambien ayuda a separar la diabetes tipo 1 de la diabetes tipo 2.
English: Examines diabetes incidence patterns among Hispanic and Latino adults, adding evidence about who is developing diabetes over time and why subgroup context matters.
Spanish: Mira quienes estan desarrollando diabetes con el tiempo entre adultos hispanos y latinos. Tambien muestra por que cada grupo puede tener riesgos diferentes.
2023 : The Impact of Social Determinants on Hispanic Diabetes Risk
Summary
English: Connects diabetes outcomes to social determinants such as neighborhood conditions, resources, care access, stress, and broader structural barriers.
Spanish: Muestra como el vecindario, los recursos, el acceso al doctor, el estres y otras barreras pueden afectar la diabetes.
English: Highlights diabetes disparities in Medicare populations and supports the need for equity-focused prevention, screening, and chronic disease management.
Spanish: Muestra diferencias en la diabetes entre personas con Medicare. Tambien explica por que se necesita mas prevencion, chequeos y cuidado justo para todos.
2024 : Diabetes Mortality Trends in a Multi-Country Analysis
Summary
English: Places diabetes mortality in a broader population-health context, showing how diabetes burden and mortality patterns vary across countries and communities.
Spanish: Muestra como la diabetes puede causar muertes en diferentes paises y comunidades. Ayuda a ver que el problema no es igual en todos los lugares.
2025 : Adapting a Text Messaging Intervention for Hispanic Diabetes Support
Summary
English: Shows how digital health outreach can be adapted for Hispanic communities through culturally aware communication, language access, and practical self-management support.
Spanish: Muestra como los mensajes de texto pueden ayudar a personas hispanas con diabetes. Los mensajes deben usar lenguaje claro, respetar la cultura y dar apoyo practico.
2025 : Diabetes and Hypertension Among Hispanic Adults
Summary
English: Focuses on the overlap between diabetes and hypertension, reinforcing why Hispanic diabetes prevention also needs heart-health and blood-pressure care.
Spanish: Explica como la diabetes y la presion alta pueden estar conectadas. Por eso, cuidar la diabetes tambien debe incluir cuidar el corazon y la presion.
2025 : Neighborhood Environment and Incident Diabetes
Summary
English: Links incident diabetes risk to neighborhood environments, emphasizing the importance of place, resources, food access, safety, and built-environment context.
Spanish: Muestra como el vecindario puede afectar el riesgo de tener diabetes. Cosas como comida saludable, seguridad, recursos y lugares para caminar pueden importar.
2025 : Navigating Continuous Glucose Monitoring Adoption Among Hispanic Adults
Summary
English: Explores barriers and facilitators to CGM adoption among Hispanic adults with insulin-treated type 2 diabetes through Spanish-language focus groups before and after 30 days of CGM use.
Spanish: Explica que ayuda o dificulta usar un monitor continuo de glucosa. El estudio escucho a adultos hispanos con diabetes tipo 2 que usan insulina.
English: Adds obesity context to the diabetes story, showing how metabolic risk, prevention, and community health conditions overlap for Hispanic and Latino Americans.
Spanish: Explica como la obesidad se relaciona con la diabetes. Tambien muestra por que la prevencion y la salud de la comunidad son importantes.
This dashboard-style page summarizes new diabetes risk, subgroup context, prevention timing, and the need to avoid treating all Hispanic communities as one identical group.
JournalPeer-reviewed public health source, 2022
Study DesignPopulation-based incidence analysis
ParticipantsHispanic and Latino adult populations
LocationsUnited States / Hispanic and Latino community focus
Summary
This article focuses on who develops diabetes over time among Hispanic and Latino adults. It supports the larger dashboard story by showing that diabetes risk is not the same for every subgroup and that prevention should happen before diagnosis whenever possible.
Key Findings
Diabetes incidence should be read as a prevention signal, not only a disease count.
Hispanic and Latino adults may face different risks depending on subgroup, age, access, and social context.
Early screening and culturally aware prevention can help reduce future diabetes burden.
📈 Incidence Risk Pathway
What this means: Incidence is about new diabetes over time, so the public-health focus is early prevention before diagnosis.
🧭 Subgroup Context Map
What this means: Hispanic and Latino subgroups can have different risks, histories, and access barriers.
The Impact of Social Determinants on Hispanic Diabetes Risk
Social determinants research, 2023
This chart page turns the article into an evidence map of neighborhood, health care, food, stress, and resource barriers.
JournalPeer-reviewed public health source, 2023
Study DesignSocial determinants review / population health analysis
ParticipantsHispanic and Latino communities affected by diabetes risk
LocationsUnited States / community and neighborhood context
Summary
This article connects diabetes risk to daily living conditions. It shows that diabetes prevention depends on more than individual choices because food access, neighborhood safety, money, stress, and care access shape what people can realistically do.
Key Findings
Neighborhood and resource conditions can raise or lower diabetes risk.
Care access, stress, food access, and income can work together as barriers.
Prevention programs should include social support, not just health advice.
🏘️ Social Risk Domains
What this means: Diabetes prevention cannot focus only on individual choices when access and neighborhood conditions shape risk.
🧩 Barrier Stack
What this means: Social barriers often layer together, making diabetes prevention harder without community support.
This chart page highlights equity themes: access, prevention, screening, chronic care, and differences across Medicare populations.
JournalCMS data snapshot / federal health equity report
Study DesignAdministrative data summary
ParticipantsMedicare populations with diabetes
LocationsUnited States
Summary
This report shows that diabetes outcomes and care experiences are not equal across Medicare groups. It supports the need for fair screening, medication access, chronic disease management, and follow-up care.
Key Findings
Diabetes disparities can appear across diagnosis, treatment, and follow-up care.
Medicare data can help identify groups that need stronger support.
Equity-focused prevention should include cost, access, and quality of care.
🏥 Medicare Equity Domains
What this means: Equity work needs prevention, screening, medication support, and follow-up care.
📊 Care Gap Signals
What this means: Disparities show up across the care pathway, not just at diagnosis.
2024 Diabetes Mortality Trends
Population patterns across places and communities.
Diabetes Mortality Trends in a Multi-Country Analysis
Global epidemiology research, 2024
This chart page shows the article’s mortality themes: diabetes deaths vary by place, time, risk exposure, and health-system context.
JournalPeer-reviewed epidemiology source, 2024
Study DesignMulti-country mortality trend analysis
ParticipantsPopulation-level mortality data
LocationsMultiple countries / international comparison
Summary
This article places diabetes mortality in a wider population-health context. It shows that diabetes deaths are shaped by prevention, complications, care access, and health system differences.
Key Findings
Diabetes mortality is not the same across places and populations.
Complications and care access are important mortality drivers.
Trend comparisons can help show where prevention and chronic care need strengthening.
🌍 Mortality Pattern Index
What this means: Mortality trends are not equal everywhere; systems and prevention conditions matter.
⚕️ Mortality Drivers
What this means: Mortality is tied to care access, complications, prevention, and chronic disease management.
2025 Text Messaging Intervention
Digital support designed for Hispanic diabetes care.
Adapting a Text Messaging Intervention for Hispanic Diabetes Support
Digital health intervention research, 2025
This chart page summarizes intervention design themes: clear language, cultural fit, reminders, trust, and practical self-management support.
JournalJMIR Human Factors, 2025
Study DesignDigital health adaptation / user-centered intervention work
ParticipantsHispanic adults and community-informed diabetes support users
LocationsUnited States / Hispanic community focus
Summary
This article explains how text messaging can support diabetes self-management when the messages are clear, culturally aware, and practical. It shows that digital tools need to fit people’s language, trust, and daily routines.
Key Findings
Plain language and culturally relevant examples make messages easier to use.
Text messages can support reminders, education, motivation, and daily self-care.
Digital health tools should be adapted with the community in mind.
💬 Message Design Priorities
What this means: Digital health tools work better when the language is clear and the content fits people’s real lives.
📱 Support Pathway
What this means: Messaging can support reminders, motivation, education, and daily self-care.
2025 Diabetes and Hypertension
The overlap between blood sugar and blood pressure risk.
This chart page frames diabetes and hypertension as connected chronic disease risks that need coordinated prevention and care.
JournalJAMA Health Forum, 2025
Study DesignPopulation health analysis / chronic disease disparities study
ParticipantsAdults with diabetes and hypertension risk
LocationsUnited States
Summary
This article connects diabetes and high blood pressure as overlapping chronic disease risks. It supports a care model where blood sugar, blood pressure, heart health, kidney health, medication access, and primary care are managed together.
Key Findings
Diabetes and hypertension often overlap and can increase cardiovascular risk.
Prevention should include blood pressure screening, diabetes control, and heart-health support.
Coordinated chronic care can help reduce complications.
❤️ Shared Risk Domains
What this means: Blood sugar and blood pressure risks often overlap, so care plans should address both.
🩺 Integrated Care Needs
What this means: Prevention, medication access, monitoring, nutrition, and primary care all matter together.
This article shows that where people live can affect diabetes risk. Neighborhood food access, walkability, safety, resources, and nearby care can make prevention easier or harder.
Key Findings
Neighborhood conditions can shape new diabetes risk.
Food access, walkability, safety, and care access are important prevention factors.
Community-level changes can support individual diabetes prevention.
🏘️ Neighborhood Factors
What this means: Place matters. Diabetes risk can be shaped by what is available around people every day.
🚶 Prevention Environment
What this means: Healthier environments make prevention easier and more realistic.
This chart page turns the public health overview into a clear map of risk, prevention, access, complications, and health equity.
JournalFederal public health overview
Study DesignPublic health fact sheet / data summary
ParticipantsHispanic and Latino Americans
LocationsUnited States
Summary
This public health overview explains diabetes burden, risk factors, and disparities affecting Hispanic and Latino Americans. It is useful for plain-language education and for showing why prevention and care access matter.
Key Findings
Hispanic and Latino Americans face meaningful diabetes risk and disparity concerns.
Prevention should include screening, food access, physical activity, education, and primary care.
Language access and affordable care are important health equity supports.
🍎 Public Health Focus Areas
What this means: Diabetes prevention needs screening, food support, active living, education, and care access.
⚖️ Equity Support Needs
What this means: Language access and affordable care help turn information into action.
This chart page connects obesity, diabetes risk, prevention, community resources, and chronic disease equity.
JournalFederal public health overview
Study DesignPublic health fact sheet / data summary
ParticipantsHispanic and Latino Americans
LocationsUnited States
Summary
This overview adds obesity context to the diabetes story. It shows how metabolic risk is connected to food access, physical activity, stress, prevention, and community health supports.
Key Findings
Obesity and diabetes risk are connected through broader metabolic health.
Prevention is shaped by food access, safe activity spaces, stress, and primary care.
Community resources can make healthy choices more realistic.
⚖️ Obesity-Diabetes Link
What this means: Obesity can increase metabolic risk, but prevention also depends on food access, stress, and neighborhood resources.
🌱 Prevention Support Areas
What this means: Prevention is easier when healthy food, safe activity, and primary care are reachable.
2026 Social Determinants, Part 2
How grouped social barriers affect diabetes prevention.
This chart page continues the social determinants story, focusing on clustered adversity, prevention needs, and practical support points.
JournalDiabetes Care, 2026
Study DesignPopulation-based cohort study with social profile analysis
ParticipantsHispanic and Latino adults in HCHS/SOL
LocationsBronx, Chicago, Miami, and San Diego HCHS/SOL communities
Summary
This page continues the social determinants evidence story by showing how several social barriers can cluster together and shape diabetes risk over time. It supports prevention that includes health care, food resources, language access, family support, and referrals.
Key Findings
Social barriers can cluster together instead of happening one at a time.
Clustered adversity can make diabetes prevention and control harder.
Support should include care access, language access, food resources, and community referrals.
🧩 Clustered Barriers
What this means: Multiple social barriers together can make diabetes prevention and control much harder.
🛠️ Prevention Support Points
What this means: Support should include health care, food resources, language access, family support, and community referrals.
📚 Hispanic Diabetes Source Library
A clean source shelf for the Hispanic diabetes evidence used in this section.
📄 Article Deep Dive
Type 1 diabetes prevalence evidence from the Hispanic Community Health Study/Study of Latinos.
The Prevalence of Type 1 Diabetes in Hispanic/Latino Populations in the United States: Findings from the Hispanic Community Health Study/Study of Latinos
Epidemiology, Kinney et al., 2020
This article adds an important type 1 diabetes layer to the Hispanic diabetes evidence story. It shows that type 1 diabetes is much less common than type 2 diabetes, but it still matters because people affected may have poor glycemic control and need targeted care.
JournalEpidemiology, 2020
Study DesignSecondary analysis of HCHS/SOL community-based epidemiologic data
Participants16,290 Hispanic/Latino adults, ages 18–74, with complete type 1 diabetes classification data
LocationsBronx, Chicago, Miami, and San Diego HCHS/SOL communities
This letter used HCHS/SOL baseline data to estimate type 1 diabetes prevalence among Hispanic and Latino adults from different backgrounds in the United States. The study used a type 1 diabetes definition based on diagnosis before age 30, current insulin treatment, and insulin use within one year of diagnosis. Among 16,290 adults with complete data, overall type 1 diabetes prevalence was 0.18%, or 1.8 per 1,000 persons. Dominican adults had the highest estimated prevalence at 0.61%, while Puerto Rican adults were estimated at 0.22%. The article also reported poor glycemic control among identified type 1 diabetes cases, with an overall average HbA1c of 9.62%. This article matters because it helps separate type 1 diabetes from the larger type 2 diabetes story while still showing that type 1 diabetes needs public health attention.
Key Findings
Overall type 1 diabetes prevalence was 0.18%, or 1.8 per 1,000 persons.
Dominican adults had the highest estimated type 1 diabetes prevalence at 0.61%.
Puerto Rican adults had an estimated type 1 diabetes prevalence of 0.22%.
Overall average HbA1c among identified type 1 diabetes cases was 9.62%.
Average HbA1c ranged from 11.52% in Puerto Rican adults to 8.22% in Mexican adults.
Evidence note: Type 1 diabetes is rare compared with type 2 diabetes, but the high HbA1c values suggest that people identified with type 1 diabetes may still face serious control and care challenges.
🩺 Type 1 Diabetes Prevalence by Hispanic/Latino Background
What this means: Type 1 diabetes is rare overall, but the estimates vary by background, with the highest estimate among Dominican adults in this sample.
⚧ Type 1 Diabetes Prevalence by Sex
What this means: The overall male and female estimates were close, so this article does not suggest a large sex gap in type 1 prevalence.
📅 Type 1 Diabetes Prevalence by Current Age Group
What this means: The estimate was higher among adults younger than 30, which makes sense because type 1 diabetes often begins earlier in life.
🧪 Average HbA1c Among Identified Type 1 Diabetes Cases
What this means: HbA1c values were high, especially for Puerto Rican adults, which points to a need for better diabetes control support.
What This Means
This article supports the Hispanics dashboard because it separates type 1 diabetes from the broader type 2 diabetes burden. The professional takeaway is that type 1 diabetes is less common, but it should not disappear from public health storytelling. A complete diabetes dashboard should explain both the larger type 2 burden and the smaller group of people living with type 1 diabetes who may need insulin access, specialty care, and stronger glycemic control support.
📄 Article Deep Dive
Social determinants, adversity profiles, and diabetes status change in HCHS/SOL from 2008 to 2024.
Profiles of Social Determinants of Health and Change in Diabetes Status Among U.S. Hispanic/Latino Adults: HCHS/SOL, 2008–2024
Diabetes Care, Brown et al., 2026
This article gives the social roots part of the diabetes story a strong evidence base. It shows that social adversity does not happen one issue at a time. Income, education, employment, housing, language, stress, family cohesion, and social support can cluster together and shape diabetes risk over time.
JournalDiabetes Care, 2026
Study DesignProspective, population-based cohort study with latent class analysis
Participants16,415 Hispanic/Latino adults, ages 18–74; 16,371 included with available SDoH data
LocationsBronx, Chicago, Miami, and San Diego HCHS/SOL communities
This study examined how social determinants of health cluster together and how those patterns relate to diabetes status among Hispanic and Latino adults. The study used HCHS/SOL data from 2008 to 2024 and identified four social adversity profiles: low adversity, social/educational strengths, acculturated and underresourced, and high adversity. The high-adversity group had the highest diabetes burden at baseline and greater odds of worsening diabetes status over time. This article matters because it shows that diabetes prevention is not only about individual choices. It is also about income, education, work, housing, stress, language, family support, and social support.
Key Findings
Four social adversity profiles were identified: low adversity, social/educational strengths, acculturated and underresourced, and high adversity.
The high-adversity group was the largest profile at about 39.70% of the sample.
At baseline, the high-adversity group had 21.86% diabetes, compared with 8.49% in the low-adversity group.
Compared with the low-adversity group, the high-adversity group had 51% higher odds of worse diabetes status at baseline.
The high-adversity group also had higher odds of worsening diabetes status at later follow-up visits.
Evidence note: This article strengthens the dashboard because it explains why diabetes disparities need both medical care and social support. The data point toward prevention that includes screening, food resources, language access, family support, and community referrals.
What this means: This combo chart makes more sense than a map because the article is about social-adversity profiles, profile size, and diabetes-risk odds over time. The high-adversity group is both the largest profile and the strongest risk signal.
🧭 Social Adversity Profile Distribution
What this means: The high-adversity group was the largest profile, showing that social adversity was not a small side issue in this population.
🩺 Diabetes Status by Social Adversity Profile
What this means: Diabetes was highest in the high-adversity group, while normoglycemia was highest in the low-adversity group.
📈 Odds of Worse or Worsening Diabetes Status
What this means: The odds rise as adversity becomes more severe, which supports a dose-response style public health story.
🧩 Individual SDoH Signals at Baseline
What this means: Several social determinants were linked with diabetes status, but the article’s strongest point is that these conditions cluster together.
What This Means
This article supports the Hispanics dashboard because it explains why diabetes burden cannot be separated from people’s daily living conditions. For Hispanic and Latino communities, diabetes prevention should include culturally aware care, social support, stable access to health care, food and income support, language support, and trusted community-based outreach.
📄 Article Deep Dive
A review article explaining why type 2 diabetes is rising among Hispanic adults in the United States.
Understanding the Growing Epidemic of Type 2 Diabetes in the Hispanic Population Living in the United States
Diabetes/Metabolism Research and Reviews, Aguayo-Mazzucato et al., 2019
This article helps explain the bigger story behind the numbers. It connects diabetes risk to social conditions, culture, biology, obesity, access to care, complications, and culturally aware prevention.
JournalDiabetes/Metabolism Research and Reviews, 2019
Study DesignLiterature review / multidisciplinary review
ParticipantsN/A, review article
LocationsUnited States, Hispanic/Latino population focus
This review explains why type 2 diabetes is a growing problem among Hispanic adults living in the United States. It says the higher diabetes burden is not caused by one thing. It comes from a mix of social factors, cultural factors, biology, obesity, insulin resistance, access to health care, health literacy, food patterns, physical activity, and diabetes self-management support. The article also reviews diabetes complications and prevention programs, including culturally tailored education and lifestyle programs. This article matters because it gives the Hispanics page the “why” behind the charts. It explains how diabetes risk is shaped by daily life, not just personal choices.
Key Findings
Hispanic adults in the United States have higher type 2 diabetes prevalence and incidence than the national average.
The review connects higher risk to lower income, lower access to education and health care, obesity, insulin resistance, and cultural and social conditions.
HCHS/SOL findings reviewed in the article show about 18% diabetes prevalence for Puerto Rican, Dominican, Mexican, and Central American adults.
Obesity is described as a major modifiable risk factor, and BMI is linked with higher diabetes prevalence.
Diabetes self-management education, lifestyle change, metformin, and culturally tailored programs are described as important prevention and management tools.
🧬 Conceptual Model of Type 2 Diabetes Risk
What this means: This recreated figure shows that type 2 diabetes does not come from one single cause. Genetic risk, social conditions, environmental exposures, and metabolic changes work together, which supports the article’s core message that diabetes is shaped by systems, not just individual behavior.
📈 Diabetes Mortality Trends Over Time
Death Rate Trends Over Time
What this means: This recreated line chart shows diabetes rising as a major cause of death over time. The bigger height gives the labels, legend, and trend lines more room so the chart is easier to read.
📊 2014 Diabetes Mellitus Death Rates
2014 Diabetes Mellitus Death Rates
What this means: This recreated bar chart shows that some Hispanic and Latin American populations carry a much heavier diabetes mortality burden than others. That supports the article’s point that diabetes risk is unequal and connected to community conditions.
What This Means
This article supports the Hispanics dashboard because it explains the larger diabetes ecosystem around Hispanic and Latino communities. It shows that diabetes prevention should include more than telling people to “eat better.” Stronger prevention needs culturally aware education, affordable care, food access, family support, safe places to be active, language access, health literacy, and trusted community programs.
📄 Article Deep Dive
Technology access, trust, language, cost, and real-world CGM use among Hispanic adults with insulin-treated type 2 diabetes.
Navigating Continuous Glucose Monitoring Adoption: Insights From Hispanic Adults With Insulin-Treated Type 2 Diabetes
Journal of Diabetes Research, Soliman et al., 2026
This article adds a technology equity chapter to the Hispanic diabetes story. It shows that CGM adoption is not just about whether a device exists. It also depends on cost, insurance, language access, provider guidance, peer examples, and whether people feel supported using the technology.
JournalJournal of Diabetes Research, 2026
Study DesignQualitative pilot study using Spanish-language focus groups
Participants16 Hispanic adults with insulin-treated type 2 diabetes
This study explored why Hispanic adults with insulin-treated type 2 diabetes may or may not adopt continuous glucose monitoring, also called CGM. Researchers held Spanish-language focus groups at the University of Miami with 16 Hispanic adults who had type 2 diabetes, used insulin, had HbA1c of at least 8%, and had not used CGM in the past 2 years. Participants first discussed barriers to starting CGM, then used real-time CGM for 30 days, then returned for a second focus group. The study found that major barriers included device cost, insurance coverage, alarm fatigue, limited culturally matched provider guidance, and lack of Spanish-language support. After using CGM, many participants reported better food awareness, better glucose control, fewer fingersticks, and a strong desire to keep using the device.
Key Findings
The study included 16 Hispanic adults with insulin-treated type 2 diabetes. Mean age was 59.68 years, and baseline HbA1c was 9.78.
Major barriers included high device costs, limited insurance coverage, alarm fatigue, lack of Spanish-language instructions, and limited culturally concordant provider guidance.
Facilitators included manufacturer discounts, peer modeling, caregiving support, real-time glucose feedback, and the desire to avoid fingerstick testing.
After the 30-day CGM trial, most participants described CGM as useful for food awareness, safety alerts, glucose control, and daily diabetes decisions.
By the 8-week follow-up, 11 of 16 participants had independently obtained a CGM through their provider and insurance benefits.
📟 Pre-CGM Barriers and Facilitators by SEM Level
What this means: CGM access problems happen at more than one level. Cost and insurance matter, but so do community exposure, provider guidance, language access, and patient confidence.
✨ Benefits Discussed After 30 Days of CGM Use
What this means: Once participants actually tried CGM, they saw practical benefits. The strongest themes were low-blood-sugar alerts and food awareness, which connect directly to daily self-management.
✅ CGM Uptake at 8-Week Follow-Up
What this means: Most participants wanted CGM enough to continue after the trial. The issue was not lack of interest. The bigger issue was access.
📈 CGM Access Pathway Over Time
What this means: This line-style chart shows the movement from no recent CGM use, to the 30-day trial, to 11 of 16 participants obtaining CGM by follow-up.
👥 Participant Snapshot
What this means: This was a small pilot group, but it focused on people with real clinical need: insulin-treated type 2 diabetes, high HbA1c, and no recent CGM use.
What This Means
This article supports the Hispanics dashboard because it moves the story from diabetes burden to diabetes tools. It shows that technology can help, but only when people can access it, understand it, afford it, and get support in their language and culture. For Hispanic adults using insulin, CGM can turn blood sugar data into daily feedback, but health systems must remove cost, insurance, language, and provider-education barriers.
🛠️
Interactive Tools
Reusable Analytics Utilities
Charts / Maps / Data Cleaning
📊
Pivot Table Explorer
Drag-and-drop pivot table powered by PivotTable.js. Slice diabetes indicators by borough, year, race, age group, and payor type. Export to CSV or Excel.
Scatter plot tool to explore correlations between diabetes prevalence and social determinants: poverty rate, food access score, insurance coverage, and PCP density.
Python automation examples for common cleaning tasks, including missing-value handling, duplicate removal, text cleanup, data type conversion, and preparing messy datasets for analysis.
Open tabular datasets in a clean browser-based viewer for quick inspection, filtering, sorting, and lightweight data review before building charts or dashboards.
Borough-level and neighborhood-level diabetes indicators including prevalence, A1C control, amputations, and dialysis. JSON format, organized by IndicatorID.
NYC DOHMH Indicator Explorer — Chronic Disease (Diabetes)
Direct link to the NYC Environment & Health Data Portal chronic disease explorer, pre-loaded with all four diabetes indicators: Adults with Diabetes, A1C > 9% (very high blood sugar), Lower Extremity Amputations (diabetes-related), and Dialysis Patients (diabetes-related). Includes maps, trend charts, borough and neighborhood breakdowns, and correlation views by poverty level.
🏥 2024 SPARCS Data — Diabetes · NYC 5 Boroughs · By Age Group
Hospital inpatient discharges filtered to diabetes CCSR diagnoses, NYC hospital counties, discharge year 2024. Each link opens directly in NY State Open Data pre-filtered to that age group.
Diabetes Without ComplicationDiabetes With ComplicationPrediabetesMaternal DiabetesNYC 5 Boroughs · sf4k-39ay
🏥 2023 SPARCS Data — Diabetes · NYC 5 Boroughs · By Age Group
Same four diabetes CCSR categories, NYC boroughs, discharge year 2023. Note: 2023 uses 3-digit zip and hospital_service_area field — Manhattan coded as "Manhattan" (vs "New York" in 2024).
Diabetes Without ComplicationDiabetes With ComplicationPrediabetesMaternal DiabetesNYC 5 Boroughs · 46xm-urtu · 3-digit zip
Official NY State DOH overview document for the 2024 SPARCS de-identified inpatient dataset (sf4k-39ay). Describes the scope, methodology, data collection process, suppression rules, and intended use of the discharge-level hospital data. Essential companion document for understanding how SPARCS data is structured and how to interpret its fields correctly.
Complete field-by-field data dictionary for the 2024 SPARCS de-identified dataset. Defines every column including APR-DRG codes, CCSR diagnosis and procedure codes, severity of illness levels, risk of mortality categories, payment typology values, and all demographic fields. Required reference for any analysis using the SPARCS Endocrine inpatient discharge data.
AHRQ Quality Indicators (QI) — Indicators List v2023
Agency for Healthcare Research and Quality (AHRQ) standardized quality measures used with SPARCS and other hospital discharge data. Covers four indicator modules: Prevention Quality Indicators (PQI), Inpatient Quality Indicators (IQI), Patient Safety Indicators (PSI), and Pediatric Quality Indicators (PDI). Published October 2023, AHRQ Pub. No. 24-0007.
Hospital inpatient discharge data measuring Pediatric Prevention Quality Indicators (PDI) for all five NYC counties — Bronx, New York (Manhattan), Kings (Brooklyn), Queens, and Richmond (Staten Island) — filtered to diabetes, beginning 2009. Reports observed rate, expected rate, risk-adjusted rate, and difference in rates per 100,000 people by discharge year and PDI number. Directly relevant to AHRQ PDI 15 (Pediatric Diabetes Short-Term Complications Admission Rate).
A blood test measuring average blood glucose over the prior 2 to 3 months. A1C greater than 9% indicates poor glycemic control and is associated with significantly higher risk of diabetes complications.
Diabetes Prevalence
The percentage of the adult population (age 18 and older) who report being told by a healthcare provider that they have diabetes. Measured via NYC Community Health Survey.
SPARCS
Statewide Planning and Research Cooperative System. Collects patient-level detail on every hospital inpatient discharge in New York State, including diagnosis, procedure, cost, and payment information. This hub uses the 2024 de-identified dataset filtered to Endocrine diagnoses (dataset ID: sf4k-39ay) for diabetes hospitalization analysis.
EHDP
Environment and Health Data Portal, maintained by NYC DOHMH. Provides hundreds of indicators on how environmental and social conditions shape health outcomes across NYC neighborhoods.
Jasmine V.
About the Creator
Health Services Administration
🌿 Bio & Mission
I'm a returning adult student at Lehman College pursuing dual degrees in Health Services Administration and Business Administration with a focus on Human Resource Management. My career goal is data analytics, with a focus on healthcare data — cleaning, analyzing, and visualizing information that can drive real public health decisions.
This portfolio focuses on diabetes because it is one of the most prevalent and preventable chronic conditions disproportionately affecting New York City's most vulnerable communities. I built this hub to bridge the gap between raw government data and accessible, actionable insight.
The teal-purple theme reflects my belief that good data work should feel grounding — calm, clear, and rooted in something real.
🛠️ Skills & Tools
ExcelJamoviHTML/CSSChart.jsData CleaningSPARCS AnalysisPublic Health AnalyticsEpidemiologyManaged Care
📚 Coursework Highlights
🔬 HSD 269 — Epidemiology & Biostatistics
📊 HSA 304 — Health Care Finance
🏥 HSA 312 — Managed Health Care
💻 Computer Applications Minor
📬 Contact
Open to internship and entry-level data analyst opportunities in healthcare.
Explore New York State diabetes medication prescription patterns by payer type, drug name, prescription volume, total paid amount, member counts, days supply, age, and sex. The charts summarize high-volume diabetes medications and payer-level spending patterns.
Loading...
14.1M
Total Diabetes Prescriptions (2023)
↑ All 3 payer types combined
$5.0B
Total Amount Paid (2022)
↑ Insurer + member combined
Medicare
Largest Payer by Prescriptions
↑ 7.4M Rx (52% of total)
Metformin
Most Prescribed Diabetes Drug
↑ 4.88M Rx across all payers
💊 Top 10 Diabetes Drugs by Prescriptions
💰 Total Paid by Payer Type
Fetching live data from NY State Open Data API...
📋 Prescription Drug Detail Table
Drug Name
Payer
Prescriptions
Unique Members
Median Days Supply
Mean Total Paid
Sum Total Paid
% Age 65+
% Female
Source: NY State All-Payer Claims Data (APD) · Therapeutic Class: Endocrine and Metabolic Drugs · 2023
⚠️
Using Cached Data
The live API requires authentication (SODA3). Showing 2022 dataset snapshot. To enable live fetching, add your NY State Open Data app token.
📰
Diabetes News & Breakthroughs
Latest Diabetes Updates
Research / Medications / Care
Fetching latest diabetes news...
🔥 Featured
GLP-1 Revolution: Semaglutide & Tirzepatide Transform Diabetes Care
GLP-1 receptor agonists like semaglutide (Ozempic/Wegovy) and tirzepatide (Mounjaro/Zepbound) have fundamentally changed how Type 2 diabetes is managed. In New York State alone, semaglutide accounted for over 731,000 prescriptions in 2022 — generating $761 million in total payments. These drugs not only lower blood sugar but reduce cardiovascular risk and promote significant weight loss, leading major guidelines to recommend them earlier in treatment pathways.
GLP-1 AgonistsCardiovascular BenefitWeight Loss
💉
Medication
Tirzepatide Approved for Type 2 Diabetes & Obesity
Eli Lilly's tirzepatide (Mounjaro for diabetes, Zepbound for obesity) targets both GLP-1 and GIP receptors — a dual mechanism that produces greater A1C reductions than single-agonist drugs. Clinical trials showed A1C drops of up to 2.3% and weight loss averaging 15-22% of body weight.
Dual AgonistFDA Approved
🧬
Research
SGLT2 Inhibitors Show Kidney Protection Benefits
Empagliflozin and dapagliflozin (SGLT2 inhibitors) have demonstrated significant kidney-protective effects beyond blood sugar control. In NY State 2023 data, empagliflozin had 1.05M+ prescriptions totaling $1.09B — reflecting rapid adoption driven by new cardiovascular and renal outcome trial data.
SGLT2Kidney Health
📊
Cost Crisis
Insulin Affordability: NY State Caps & Federal Action
Insulin glargine remains the second most prescribed diabetes drug in NY (1.13 million Rx, $441M total paid in 2022). New York's insulin cost-sharing cap of $100/month and the federal Inflation Reduction Act's $35 Medicare cap are beginning to reduce out-of-pocket burdens for patients.
PolicyAffordability
🤖
Technology
Closed-Loop Insulin Systems (Artificial Pancreas)
Hybrid closed-loop systems that automatically adjust insulin delivery using continuous glucose monitor readings have received expanded FDA clearance. These systems dramatically reduce hypoglycemia risk and improve time-in-range metrics, particularly for Type 1 diabetes patients.
CGMType 1
🏥
NYC Focus
NYC Health + Hospitals Expands Diabetes Prevention
NYC's public hospital system has expanded the National Diabetes Prevention Program (DPP) at all 11 facilities. Targeting neighborhoods with the highest Bronx and Brooklyn diabetes rates, the program offers lifestyle coaching to prevent progression from prediabetes to Type 2 diabetes.
PreventionNYC
🔬
Pipeline
Oral GLP-1s & Once-Weekly Insulin in Development
Oral semaglutide (Rybelsus) is already available; once-weekly insulin icodec received FDA approval in 2024. Multiple oral GLP-1 candidates are in Phase 3 trials that could dramatically improve adherence by eliminating injections for millions of patients with Type 2 diabetes.
PipelineOral GLP-1
⭐
Diabetic Recommended
Evidence-Based Resources
Apps / Tools / Lifestyle
💊 Recommended Medication Classes
Based on ADA Standards of Care 2024 and NY State prescribing data. Always consult your healthcare provider.
🥇
Metformin — First-Line Standard
Most prescribed diabetes drug in NY State (4.88M Rx in 2022). Affordable, effective, and well-tolerated. Reduces hepatic glucose production. Recommended as first-line therapy by ADA for Type 2 diabetes unless contraindicated.
First-LineGeneric Available$84M Total Paid (NY 2022)
💉
GLP-1 Receptor Agonists
Semaglutide and dulaglutide are among the top 5 most prescribed diabetes drugs in NY State. These medications reduce A1C, promote weight loss, and offer proven cardiovascular benefits. ADA now recommends them early in treatment, especially for patients with heart or kidney disease.
Cardiovascular BenefitWeight Loss731K+ Rx in NY 2022
🫀
SGLT2 Inhibitors
Empagliflozin, dapagliflozin, and canagliflozin reduce blood sugar by removing glucose through urine. Strong evidence for heart failure prevention and kidney protection. 725K+ empagliflozin prescriptions in NY in 2022 reflect growing clinical adoption.
Kidney ProtectiveHeart Failure Benefit$609M NY 2022
⚗️
Insulin Therapy
Insulin glargine is the second most prescribed diabetes drug in NY (1.13M Rx, $441M). Long-acting insulin remains essential for Type 1 diabetes and many Type 2 patients. Newer formulations offer once-weekly dosing (icodec) and faster action profiles.
Essential for Type 1Basal Insulin$35 Medicare Cap
📱 Recommended Monitoring Tools
📡
Continuous Glucose Monitors (CGM)
✅ Dexcom G7 — 10-day wear, real-time alerts, no fingersticks
NY Medicaid covers CGMs, diabetes supplies, and most diabetes medications. NYS Programs accounted for 4.7M prescriptions in 2022 alone.
💬
Community Blog & Forum
Personal Notes and Shared Learning
Diabetes / Public Health
✍️ Share Your Thoughts
4 posts
🏥
2024 SPARCS Data
Diabetes · NYC Hospital Data
NYC 5 Boroughs / Age Groups
SPARCS 2024 Diabetes Hospitalization Dashboard
Explore 2024 SPARCS inpatient discharge records for diabetes-related hospitalizations across New York City boroughs and age groups. This page compares discharges, length of stay, charges, payer mix, severity, risk of mortality, admissions, facilities, and borough summary patterns.
Download the CSV from the SPARCS link above and upload it here to see the full dashboard for this age group.
639
Total Discharges
↑ NYC 5 Boroughs · 2024
3.0
Avg Length of Stay (days)
↑ Median 2.0 days
$56,335
Mean Total Charges
↑ Median $40,993
65%
Medicaid Share
↑ 415 of 639 discharges
81%
Emergency Admissions
↑ 558 of 639 discharges
98%
Diabetes With Complication
↑ 628 of 639 discharges
🔍 Key Finding: 98% of pediatric diabetes hospitalizations in NYC (2024) involved complications — suggesting children are often not reaching care until their diabetes is already serious. 87% arrived through the Emergency Department rather than planned admissions.